Organizations are constantly seeking new ways to store, manage, govern, interpret, and repurpose data to make it useful for day-to-day management and decision making. Implementing robust storage systems to ensure data remains secure and having the analytics tools that interpret the volumes of data into something meaningful are key to taking data and turning them into actual insights.
One way to gain a holistic view of organizational operations is a “knowledge graph”. As the name suggests, a knowledge graph brings multiple data points, data sets, and elements together to establish relationships between two or more entities at once. In short, a knowledge graph turns data into knowledge.
Technology giant Google was the first company to use knowledge graphs to combine multifaceted data and present accurate results to users. Google uses their ‘Google Knowledge Graph’ to connect words, numbers, pictures, and other entities across the internet to bring you the most accurate results. This solution has since gained many organization’s attention with its ability to simplify data interpretation for technology and business executives.
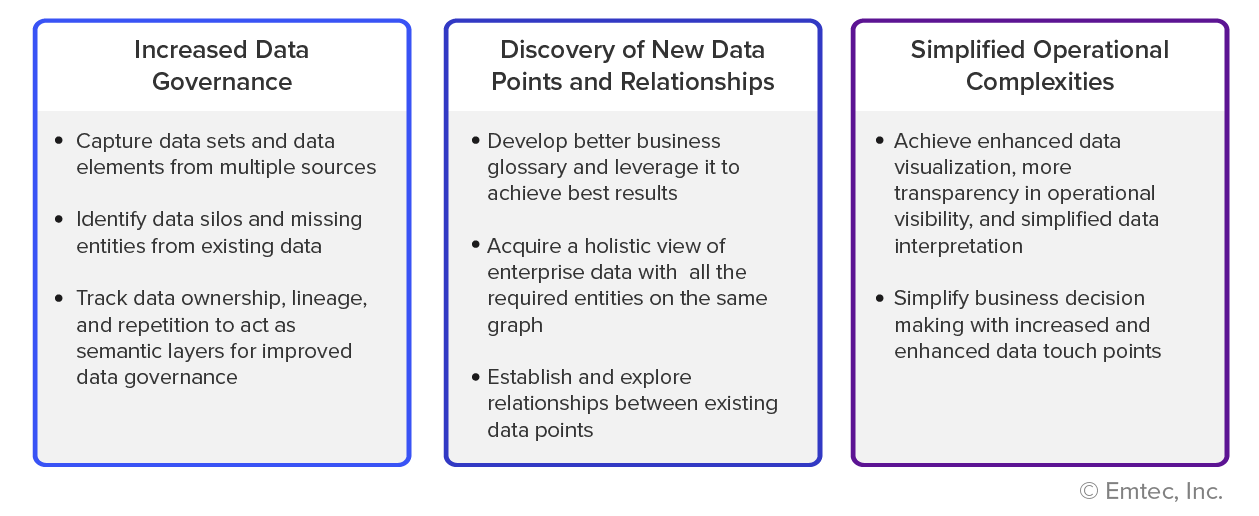
Some of the technology benefits gained by implementing knowledge graphs include –

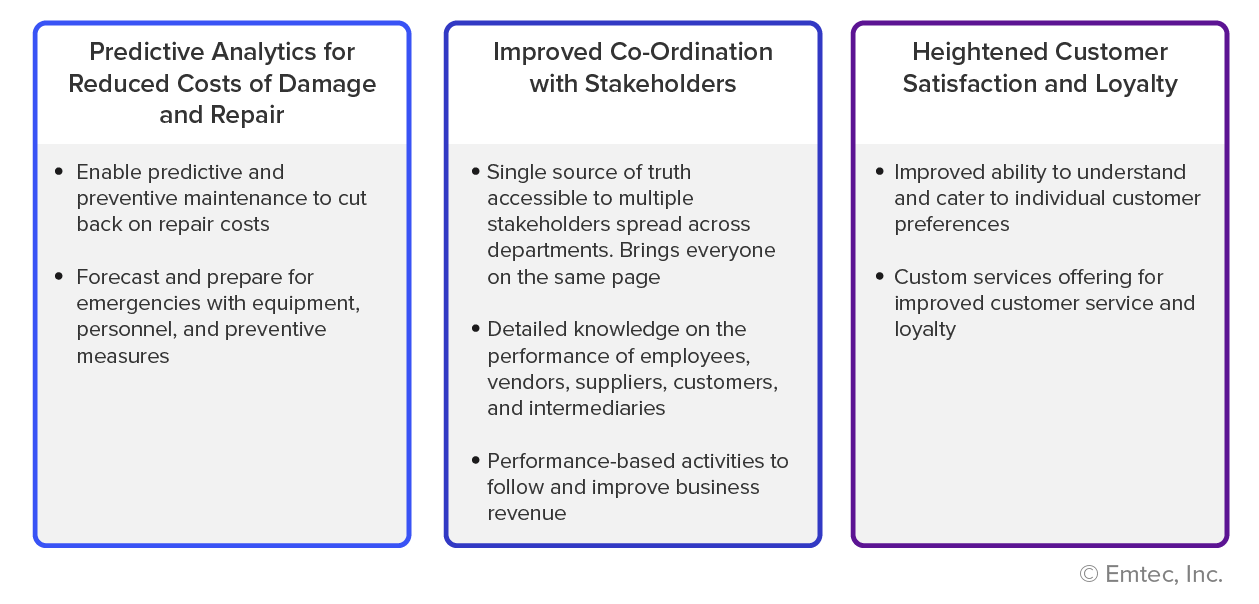
The technical benefits of knowledge graphs can impact the way businesses are run. Here are some ways knowledge graphs enhance business operations –

How are knowledge graphs used within a business context? Here are a few examples of how organizations are unlocking the true potential of knowledge graphs by industry-
Banking & Finance
- Smart investment
Utilizing a system with historical financial data combined with effective wealth management methods, knowledge graphs can be used as a data engine to identify smart investments. With historical data ingested into enterprise systems, knowledge graphs can be leveraged to make smart investments without going through days or even weeks of research.
- Natural Language Processing enabled bots
Automation in knowledge graphs is seeing rapid adoption. Several financial institutions are using AI-powered chatbots and conversational agents to cater to customer needs. Customers seek information either through text or speech, and knowledge graphs provide them with accurate financial data. Whether it is for asset management, hedge fund analysis, investments, or divestments, knowledge graphs extract meaningful insights in real time after gathering parameters from customer interactions to rapidly deliver accurate data. Easy access, high availability, and accuracy of financial information makes knowledge graphs and AI-powered chatbots a great advantage for financial and banking institutions.
Insurance: Detecting fraudulent activities and people
One of the biggest challenges for any insurance firm is fraud detection. With the rise in cases of forgery and identity theft, insurance companies are at risk. Knowledge graphs can easily verify the accuracy of personal information such as addresses and social security numbers with official government and police records. Insurance companies can monitor fraudulent activities and mitigate their risk through entity resolution and a visual analytics interface provided by knowledge graphs.
Energy: Equipment Management
The Energy industry has benefitted by leveraging knowledge graphs for power equipment management. To enable complete asset lifecycle management, energy companies have adopted knowledge graphs to display asset usage, maintenance, repair, and downtime. Knowledge graphs successfully identify missing or duplicate data (both structured and unstructured) and significantly improve data accuracy by highlighting untimely updates from multiple sources at a power station. Data scientists can obtain exact information on the components, internal and external lines, voltage, power conducted, and name of the operator for every transformer. This helps in efficient power equipment management.
Digital twins are often employed by energy companies to gain a holistic view of energy operations – from production and transmission to distribution. Here, knowledge graphs can provide substantial insights on substation performance, communication, customer consumption, and more. This helps extract valuable information across grids, understand consumption patterns, manage production accordingly, and thereby avoid energy wastage, theft, and loss.
Logistics: Inventory Management
The Logistics and Supply Chain industry is on an upward growth trajectory thanks to the increased demand from e-commerce sales. While the secret sauce of an efficient logistics system is strong inventory upkeep, the efficiency of the supply chain depends on smart operational insights. Knowledge graphs can combine both elements together and contribute to a productive logistics and supply chain enterprise. These graphs can plot any permutation and combination of desired manufacturers, products, vehicles, distributors, employees, customers, operational data, and more, thereby enabling efficient inventory management. Knowledge graphs help answer significant questions to optimize supply chain operations like –
- Are organizations overspending in any specific area?
- Is the demand and supply ecosystem being balanced effectively?
- Is there a need to onboard new manufacturers or source from other industry players?
Retail: AI-enabled bots for personalized shopping
A great customer experience is the core of retail success. Personalized conversations, instant access to information, smart insights, and fact-based advice fuel superior customer experiences. An AI-powered bot can do all of this with the help of knowledge graphs by creating personalized recommendations for customers. For a global marketplace witnessing a million plus visitors daily, this sure is a game changer. Knowledge graphs provide the necessary data acumen to retailers, facilitating immense cost savings and enabling rich customer experiences.
Getting started with knowledge graphs
Setting up knowledge graphs begin with acquiring a clear understanding of the current technology investments and talent. This will help determine whether you can implement the solution in house or if you need to engage with an external resource or trusted partner. An initial data and systems assessment will help you define clear implementation objectives and identify the as-is vs to-be scenarios. With a focused goal in place, extracting knowledge from enterprise data becomes easier.

The amount of raw enterprise data being produced is increasing at an astounding pace, and diversified implementation of knowledge graphs is the next big disruption that will revolutionize global industrial growth in the coming years.
Evolving global market dynamics fueled by rapid advancements in emerging technologies will likely introduce even more use cases for implementing knowledge graphs. After all, data is knowledge, and knowledge is power.
At Bridgenext (formerly Emtec Digital), we focus on helping our clients build advanced enterprise data architectures to analyze and process significant volumes of structured and unstructured data to garner meaningful business insights. Contact us today for a free assessment of your current enterprise data architecture and boost your digital transformation efforts through data-driven decision making.


